makerdad
makerdad
Visualizing LIDAR Data
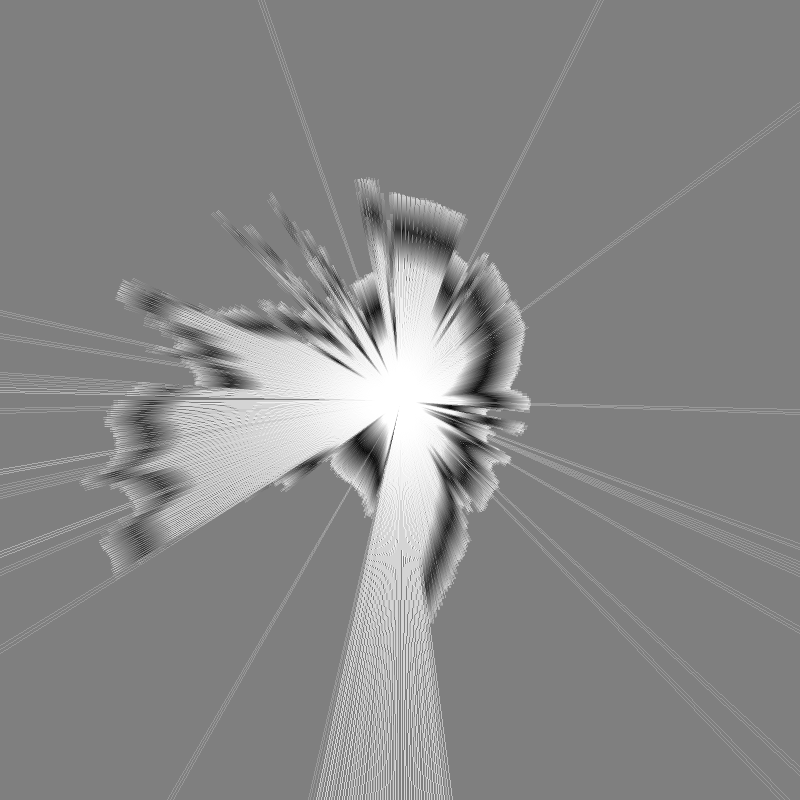
I had my first try at visualizing incoming data from the LIDAR tonight. Good news is that it worked, and I got a successful SLAM map of the room. That’s pretty awesome.
Bad news is I definitely have to redesign the pulley mechanism. Stepper motor is ridiculously loud, heavy and slow. I need to design a smaller pulley system that runs on an encoded DC motor.
I used a Python library called BreezyLIDAR for the SLAM implementation. It really simplifies the amount of work you have to do. I had to do some figuring out on Python serial comms, but once I got the data from Arduino to Jupyter, I had the image rendered in a few minutes. Here is the relevant piece of code:
import io
import PIL.Image as Image
import IPython.display

MAP_SIZE_PIXELS = 800

from breezyslam.sensors import Laser
from breezyslam.algorithms import RMHC_SLAM

garmin = Laser(332, 4, 360, 4000)

slam = RMHC_SLAM(garmin, MAP_SIZE_PIXELS, 7)

for i in range(TOTAL_SCANS):
    slam.update(scans_mm[i])

map_data = bytearray(MAP_SIZE_PIXELS * MAP_SIZE_PIXELS)

slam.getmap(map_data)

image = Image.frombuffer('L', (MAP_SIZE_PIXELS, MAP_SIZE_PIXELS), map_data, 'raw', 'L', 0, 1)

IPython.display.display(image)
So, success on the software but back to the drawing board on the mechanical. This is not such a big deal, since I can apply the learnings to the new design. Notes for v2:
- Keep pulleys as small as possible
- Reduce timer belt distance to 200mm if possible (currently 400mm)
- Move QRD1114 to the bottom for easier mounting (and hiding the calibration disk)